1. Market Context & Trend Structure
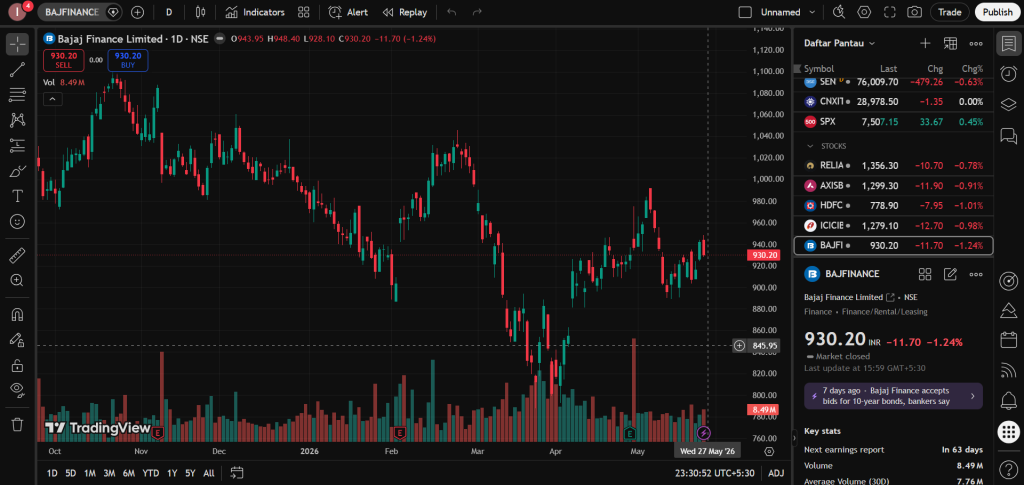
- Primary Trend Classification: The daily candlestick chart for Bajaj Finance Limited (BAJFINANCE) exhibits a structurally defined primary downtrend over the observed multi-month period, transitioning from late 2025 into mid-2026. This is characterized by a sequential textbook progression of Lower Highs (LHs) and Lower Lows (LLs). The peak observed around November 2025 established a major swing high, after which subsequent rallies have consistently failed to challenge prior peaks, indicating persistent selling pressure at higher levels.
- Historical Support and Resistance Zones:
- The Upper Supply Zone (~1,040 – 1,060): This region acted as a critical distribution area in late 2025. Rallies into this zone were met with strong rejection, confirming it as a historical structural resistance.
- The Intermediate Pivot Zone (~960 – 980): Previously serving as a minor support area during the early phases of the descent, this zone later inverted to act as resistance during a late-April counter-trend rally, demonstrating the classic technical principle of “support turning into resistance.”
- The Major Demand Floor (~800 – 840): The sharp sell-off extending into late March and early April found a significant localized bottom in this zone. The rapid deceleration of downward momentum and subsequent sharp rebound from these lows highlight historically significant buying interest/liquidity accumulation in this structural pocket.
2. Technical Observations & Indicator Analysis
- Chart Pattern Identification: The structural price action from February through May 2026 outlines a potential Double Bottom or Rounded Accumulation Base near the 800–840 demand zone. The sharp decline in March forms the first trough, followed by an aggressive, high-volume counter-rally in April. The subsequent pullback in late April to early May forms a shallower secondary low, which structurally preserves the integrity of the March swing low (a Higher Low relative to the absolute bottom).Currently, the price is trading near the 930.20 mark, approaching the neckline or pivot high of this corrective base structure.
- Volume Profile Analysis:
- Capitulation Volume: The absolute price bottom formed between March and April coincides with a substantial expansion in vertical volume bars. In technical charting, exceptionally high volume at multi-month price lows frequently signifies a potential capitulation event, where panic selling is absorbed by institutional or long-term buyers.
- Ascending Volume on Rallies: The initial sharp impulse leg off the bottom shows relatively robust volume bars compared to the subsequent corrective pullbacks, suggesting a momentary influx of demand during upward expansions.
3. Case-Study Scenarios & Risk Frameworks
To understand market dynamics from a textbook perspective, technical analysts evaluate structural boundaries through binary, hypothetical frameworks.
- Scenario A: Textbook Bullish Continuation (Neckline Breakout)If the market structure experiences an expansion of demand that drives the price cleanly above the current structural pivot resistance around the 960–980 zone on expanding volume, standard technical theory suggests a validation of the reversal pattern. According to classical chart principles, such a breakout signals the exhaustion of the primary downtrend and the potential initiation of a new upward structural phase (Higher Highs), targeting historical overhead supply zones.
- Scenario B: Textbook Bearish Continuation (Support Failure)Conversely, if the asset encounters rejection at the current overhead pivot levels and breaks cleanly below the recent historical demand floor of 800–840, standard technical theory dictates a continuation of the primary downtrend. A decisive breach of such a major demand zone implies that supply remains dominant, invalidating the prospective accumulation pattern and opening the path toward lower historical liquidity pools.
- Abstract Risk-to-Reward & Position Sizing Frameworks:Professional market participants utilize strict mathematical frameworks to manage capital risk, entirely separate from asset direction.$$\text{Position Size} = \frac{\text{Total Account Risk (\text{₹})}}{\text{Trade Risk Per Share (\text{₹})}}$$Where Trade Risk Per Share is defined as the absolute distance between the trade entry price and a predefined structural invalidation level (stop-loss). By maintaining a structural Risk-to-Reward ratio (R:R) of at least 1:2, a market participant ensures that the financial gain from successful structural expansions mathematically outpaces the cumulative losses of invalidated setups over a large sample size of trades.
4. Mandatory Educational Disclaimer
“Disclaimer: This analysis is published strictly for educational and informational purposes on Hashtoo.com. It highlights historical chart patterns and technical analysis principles for study. It does not constitute financial advice, investment tracking, or a SEBI-registered recommendation to buy, sell, or hold any security. Capital markets involve substantial risk; individuals must perform independent research or consult a certified financial advisor before executing trades.”
