1. What is Happening to Bitcoin Right Now?
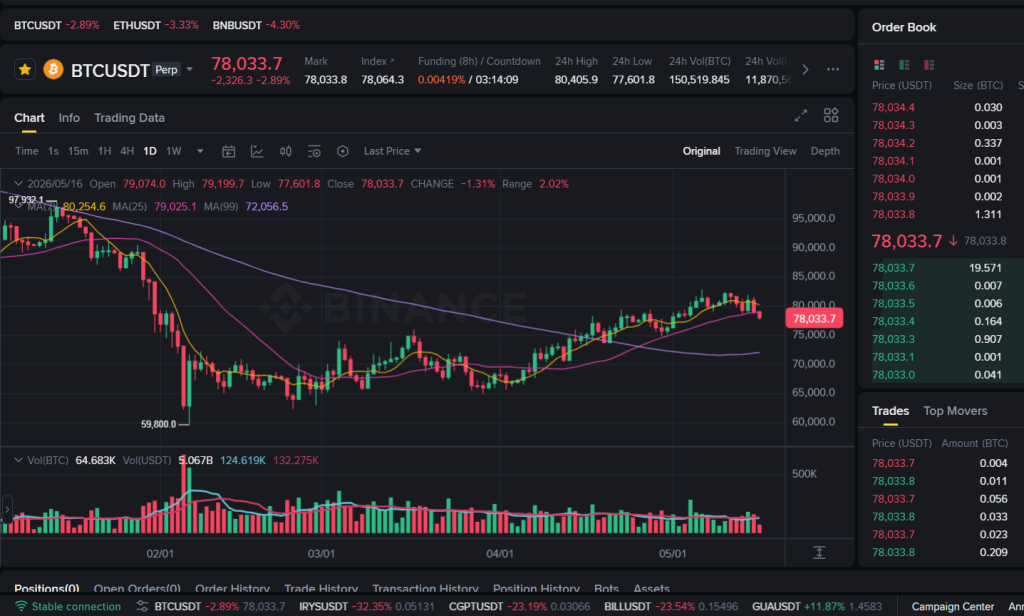
If we look at the daily chart of Bitcoin (BTCUSDT), the price is currently moving inside a downward path or a “Falling Channel.” After making high prices a few months ago, Bitcoin is now taking a rest. This is called a Correction Phase. In simple words, the market is shaking out weak traders who took high risk with borrowed money (leverage). This down-movement looks scary, but it is a normal way for big players (institutions) to buy Bitcoin at lower prices from panicked retail traders.
2. Understanding the Chart Lines (Moving Averages)
Look at the lines running across the screen on the trading chart. These lines tell us who is stronger right now—the Buyers or the Sellers.
- The Short-Term Line (25 Moving Average): Right now, the price candles are trading below this line. This means that in the short term, sellers are more powerful. Every time the price tries to go up, it touches this line and falls back down.
- The Medium-Term Line (99 Moving Average): The price has slipped below this line too. This shows us that the market is in a deep discount zone. Until the price crosses back above this line, the market will stay slow and heavy.
3. Looking at the Volume (Trading Activity)
At the bottom of your trading screen, you can see vertical bars. That is Volume. It shows how many coins are being bought or sold.
- When the price fell sharply, the volume bars became very tall. This means many traders got scared and closed their trades at a loss, or their accounts got washed out because of high leverage.
- Right now, the volume bars are becoming very small. This is a good sign for learning. It shows that the urgent selling pressure is stopping. The market is becoming quiet, and buyers and sellers are reaching a balance near the $78,033 price mark.
4. Two Ways the Market Can Go Next
Because nobody can predict the future 100%, a good analyst always looks at both sides of the coin:
Plan A (If Buyers take control):
If Bitcoin stays steady and does not fall further, buyers will slowly build strength. If the price breaks above the top line of the falling channel with high volume, it means the correction is over. The market can start its upward journey again.
Plan B (If Sellers stay strong):
If big global sellers keep pushing the price down, the current floor might break. If the price closes a full daily candle below the support floor, it can slide down further to find a new, cheaper level where big banks and investors are waiting to buy.
5. Summary for Smart Traders
This chart shows that Bitcoin’s movement is completely controlled by mathematical formulas and big trading systems. It is not moving randomly out of panic.
By learning to read these lines, volume bars, and shapes on the chart, you can become a disciplined analyst. Instead of losing money by gambling on quick tips, you can use your chart knowledge to build a real career and earn money by posting your research on Hashtoo.com.
Important Note (Disclaimer):
This post is only for learning and education. We do not give any “Buy” or “Sell” calls here. We do not tell you to trade or invest. Trading in Bitcoin and the stock market involves big financial risks. Please talk to a certified financial advisor before putting your real money into the market. The writer receives a fixed page-formatting fee from Hashtoo.com for writing this educational report.
Post Approved For: Hashtoo Educational Hub (Hindi/English Market Analysis) Verification ID: HT-EDU-BTC-2026
