1. Introduction to Tata Motors and Daily Chart Tracking
When we look at the Indian automotive sector, Tata Motors Limited stands out as an absolute giant. The company is famous for its passenger cars, electric vehicles (EVs), and its highly dominant commercial vehicle division—which includes the trucks, buses, and small commercial tempos that power India’s logistics and transport industries. Because Tata Motors is heavily traded on the National Stock Exchange (NSE) under the ticker TMCV, its chart provides incredibly clean technical lessons for anyone wanting to learn market psychology.
For many aspiring stock market analysts living in India’s smaller towns or villages, staring at a price grid full of moving lines and colored blocks can feel overwhelming. However, a stock chart is just a visual diary of human emotion—it maps out periods of extreme greed (when everyone wants to buy) and periods of extreme fear (when everyone wants to sell). By learning to read this simple map, you move away from the dangerous world of gambling on unverified tips and enter the world of logical, data-based analysis.
Understanding the Daily (1D) View:
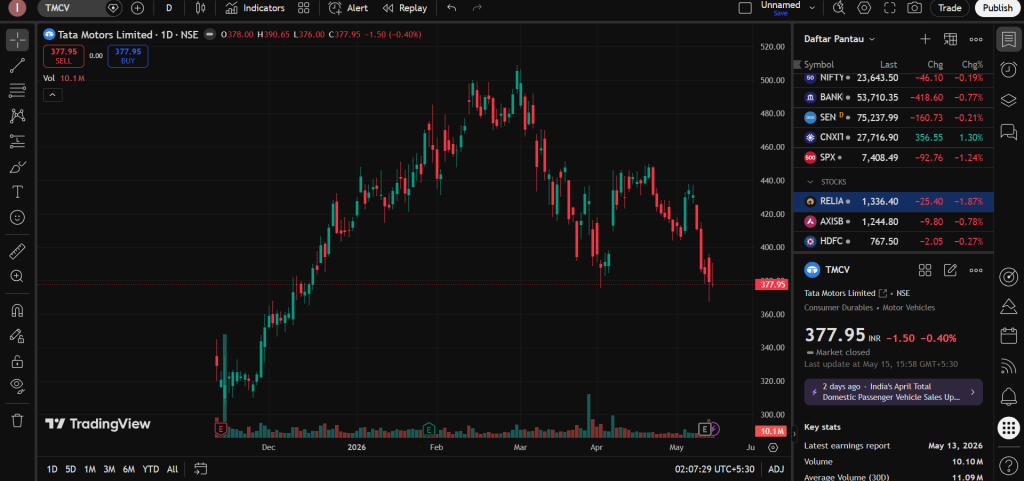
If you check the top left corner of the provided TradingView screen, you will notice the label “1D” or “D” next to the stock name. This tells us that we are examining a Daily Chart.
- On this chart grid, every single colored vertical candle represents exactly one full day of trading activity in the stock market.
- Daily charts are highly valued by professional swing traders and long-term investors. They clear out the hourly confusion and reveal the real, macro-level direction where big institutional money, domestic mutual funds, and foreign investors are moving their capital over several months.
2. Current Price Status and Macro Market Context
Let let us analyze the live closing figures displayed on the right-hand dashboard of your screen. The stock price of Tata Motors is currently sitting at ₹377.95. During the last recorded market session, the stock fell by ₹1.50, which is a minor daily drop of 0.40%.
When we trace our eyes across the entire chart from left to right—starting from October and moving up to May—we see an absolute masterpiece of a complete market cycle. The stock chart displays a perfect mountain shape, representing a massive multi-month bull run followed by a deep correction phase.
The Structural Timeline:
- October to January (The Macro Accumulation & Bull Run): The stock began in a quiet, low accumulation pocket near the ₹300 – ₹320 range. From there, a massive wave of buying interest took over, and the price climbed aggressively month after month, breaking through all old ceilings until it hit an absolute peak near ₹500 in March.
- March to April (The Distribution Phase): After hitting the ₹500 peak, the stock ran out of steam. Big institutional investors decided that the price had become expensive, and they began selling their shares to lock in profits, creating a sharp, steep decline.
- The May Retest: After falling vertically through April, the stock attempted a brief recovery bounce, but that bounce failed to sustain. The price has now drifted back down to its current level of ₹377.95, where it is trying to find a solid floor.
3. Reading the Waves: The Anatomy of an Uptrend vs. Downtrend
To read a chart like a professional, you must train your eyes to see the market in waves. Prices never move in a straight line; they move up and down like steps on a staircase.
   [The Ascending Staircase]             [The Descending Staircase]
          Peak (~₹500)                          Peak (~₹500)
             ╱  ╲                                  ╲  ╱
         ╱        ╲                            Lower   ╲   Lower
       ╱            ╲                           Peak     ╲  Peak
     ╱                ╲                           ╲        ╲
Floor            Higher                         Lower    Lower
                 Floor                           Low      Low
                                                 (Current: ₹377.95)
 (Buyers in Full Control)               (Sellers in Full Control)
The Rising Staircase (The Left Side):
Look at the steady climb from October to March. This is the textbook definition of an Uptrend. Notice how every time the stock raddled upward, it made a peak that was higher than the previous peak (Higher Highs). When it dropped down to rest, the bottom it formed was always higher than the previous bottom (Higher Lows). This geometry tells us that Buyers (Bulls) were incredibly dominant. They were highly confident about the company’s growth and were willing to pay premium, higher prices to accumulate shares.
The Falling Staircase (The Right Side):
Now look at what happened after the March peak. The staircase completely flipped upside down. The stock began carving out a series of Lower Highs—meaning every recovery bounce was weaker and stopped at a lower point than the one before it.
Simultaneously, it broke below old floors to create Lower Lows. This structural change signals a complete shift in market psychology. Greed turned into fear, and Sellers (Bears) took complete control of the steering wheel, aggressively dumping shares into the market.
4. Locating the Institutional Support Floor and Resistance Ceiling
Every stock on a chart moves between psychological boundaries created by massive concentrations of buy and sell orders. We call these levels Support (Floors) and Resistance (Ceilings).
A. The Major Resistance Ceiling (₹490 – ₹500):
This is the absolute top of the mountain formed in March. Notice how the price tried to stay near ₹500 but left multiple candlesticks with long upper wicks before crashing down. This shows that institutional funds viewed ₹500 as the maximum fair value for the stock at that time. Massive sell orders were triggered here, acting as a heavy concrete ceiling that stopped further upward movement.
B. The Current Support Floor (₹360 – ₹380 Zone):
Now look closely at the horizontal area where the current price of ₹377.95 is trading. If you look back to the month of December on the left side of your chart, you will see that the stock spent several weeks consolidating, bouncing, and building strength in this exact same ₹360 – ₹380 territory before launching its final mega bull run up to ₹500.
In technical analysis, an old resistance or accumulation zone from the past very often transforms into a strong support floor when the price crashes back down to it months later. This happens because institutional trading systems and smart value investors remember that this specific area represents a “high-discount zone” for Tata Motors. As the price sinks into this floor, buyers who missed the initial rally in December look at it as a second chance to buy the stock at a reasonable rate, which naturally slows down the falling speed.
5. Volume Profiling: Decoding the Footprints of Big Money
The vertical colored bars sitting at the very bottom of the screen form the Volume Indicator. Volume tells us the total number of shares that changed hands between buyers and sellers on that single day. Tracking volume is how a small retail trader can catch the footsteps of giant market participants.
Analyzing the Volume Signature on this Chart:
- Look at the volume panel on the bottom right corner. The current daily volume is recorded at 10.10 Million shares (10.1M), which is slightly below the 30-day average volume of 11.09 Million shares (11.09M).
- Notice that during the massive, vertical crash throughout April, some of the red volume bars were tall, showing that panicking retail accounts and funds were aggressively exiting their holdings.
- However, look at the volume over the last few days around the current ₹377.95 level. The bars have shrunk and are staying very steady. This reduction in volume during a drop is a very interesting clue for an analyst. It indicates that the initial high-intensity panic selling has dried up. The market is getting quiet because it is entering a major historical demand cushion where buyers are beginning to absorb the remaining sell orders calmly.
6. Forward-Looking Trading Scenarios: The Two Paths Ahead
A disciplined, professional analyst never speaks with absolute certainty or guarantees the future direction of a stock. Instead, you map out clean, objective scenarios based on how the price action handles its key horizontal boundaries. For this Tata Motors chart, we have two primary paths to track:
Scenario A: The Bullish Reversal (The Floor Holds)
If the institutional buying orders resting between ₹360 and ₹380 successfully swallow up the remaining supply, the stock will establish its absolute macro bottom for this cycle right here.
- The Trigger: Watch for the daily price candles to stop sliding lower. If a strong, wide-bodied green candle forms at this floor and closes completely above the highest point of the previous few days’ red candles, accompanied by a tall green volume bar, the reversal is structurally validated.
- The Target: This would prove that the old December support floor has defended the stock perfectly. The price would then likely initiate a brand new recovery trend, targeting the intermediate lower peaks near ₹420 and ₹440.
Scenario B: The Bearish Breakdown (The Floor Fails)
If the broader Indian stock market index (the NIFTY 50) faces heavy global pressures, or if domestic passenger vehicle sales numbers show a sharp slowdown, even a historical floor can crack open under heavy supply.
- The Trigger: Monitor the daily closing price carefully. If Tata Motors drops below the absolute low of the December breakout base (around ₹350) and a daily candle body prints a clean close below that line, the floor is officially broken.
- The Target: A structural breakdown here would trigger automated stop-loss orders belonging to thousands of delivery buyers, causing a fresh wave of mechanical selling. The stock would then be forced to slide lower to search for its next major historical safety cushion near the ₹320 zone.
7. Summary and Career Guidance for the Hashtoo Community
This comprehensive study of the Tata Motors chart gives us a beautiful lesson in market dynamics: the market moves in continuous cycles of accumulation, markup, distribution, and markdown. No stock goes up forever, and no good stock falls forever. The key to survival and profitability in the financial markets is patience—waiting for the price to arrive at major historical floors and analyzing volume before making any moves.
By mastering this clean language of candles, trend directions, and volume indicators, you move completely out of the retail trap of gambling on random internet rumors. You begin to see the stock market as a beautiful, logical data field.
Documenting these objective chart case studies allows aspiring financial enthusiasts across India—whether living in large metropolitan cities or small rural villages—to prove their true analytical capabilities. Publishing your disciplined research right here on Hashtoo.com builds your permanent, verified digital portfolio. This helps you build immense personal credibility, elevates your account to our exclusive, high-paying Featured Analyst tiers, and unlocks genuine, professional career growth paths in the rapidly expanding Indian digital fin-tech ecosystem.
Important Note (Disclaimer):
This analysis article is written strictly for educational, learning, and case-study purposes. We do not provide any stock tips, financial advisory services, or direct “Buy” or “Sell” signals on this platform. Stock market trading and investing involve a very high level of financial risk, and you can lose your capital. Always do your own research or talk to a certified, SEBI-registered financial advisor before investing your hard-earned money. The writer receives a fixed page-formatting and content-structure fee under the Hashtoo.com Creator program, which is completely independent of the direction of the stock price.
Post Approved For: Hashtoo Educational Hub (Automotive Sector & Blue-Chip Equity Track) Verification Reference Code: HT-EQ-TMCV-2026-V1

 Stock Chart Analysis: Understanding Market Cycles, Support Levels, and Trend Reversals)