1. What is Happening to TCS Stock Right Now?
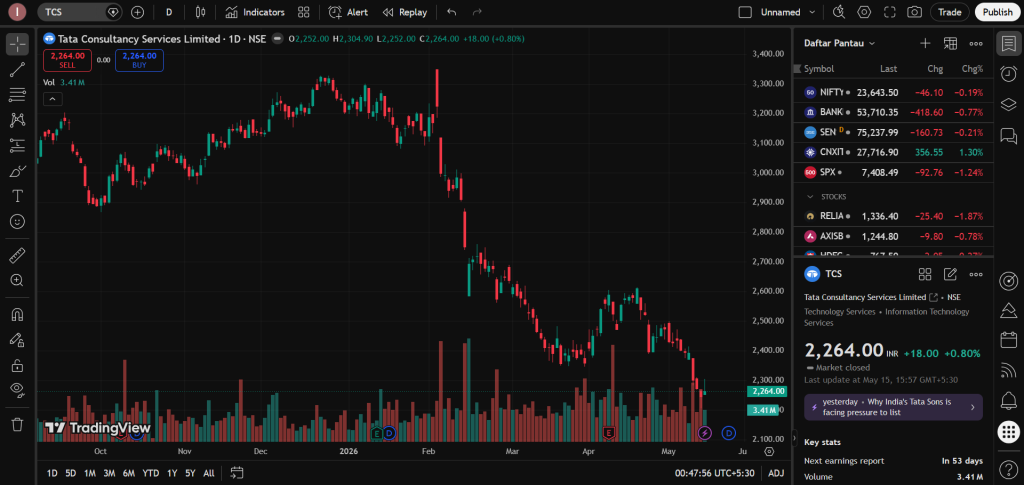
If we look at the daily chart of TCS on TradingView, the stock has been in a strong downward trend for the past few months.
Earlier, the price was high, near the ₹3,300 level. After hitting that peak, the price started falling sharply. Right now, the market is trading near ₹2,264.
In simple words, the sellers are completely in control of this stock right now, and the price is moving down to find a cheap level where big institutional buyers might want to step in again.
2. Understanding the Chart Shapes and Patterns
When you look at the price candles on the screen, you can see a clear pattern:
- Lower Highs and Lower Lows: Every time the stock tries to jump up, it stops at a lower point than the previous jump. This shows that buyers do not have enough strength to pull the stock up.
- The Big Fall (February to April): You can see long red candles falling straight down. This happens when big funds or investors decide to exit their positions, creating a panic among small retail traders who also sell their shares in fear.
3. Looking at the Volume Bars
At the bottom of the chart, you can see the vertical red and green bars. This is the Volume, which shows how many shares are being traded each day.
- During the biggest price drops in February and March, the volume bars were quite tall. This means a very large number of shares were dumped in the market.
- Right now, at the ₹2,264 level, the volume bars are starting to look more average. This tells us that the initial heavy panic selling is slowing down, and the price is trying to find a temporary resting spot or a Support Floor.
4. Two Ways the TCS Stock Can Move Next
As a smart analyst, you should always look at both possibilities before making a conclusion:
Plan A (If the Stock Recovers):
If the ₹2,250 to ₹2,260 level acts as a strong floor, the price will stop falling. If green volume bars start getting taller and the price crosses above the recent small peaks, it means buyers are returning, and the stock can start a slow recovery.
Plan B (If the Fall Continues):
If the market pressure stays bad and the price breaks below the current ₹2,250 support floor with a full daily candle, it will trigger more stop-losses. The stock will then slide down further to find a deeper historical level where shares look even cheaper to long-term investors.
5. Conclusion for Smart Traders
This TCS chart teaches us a very important rule: Never try to catch a falling knife. Just because a good company’s stock has become cheaper does not mean it cannot fall more.
By reading these volume bars and price trends patiently, you protect your capital. You can use this chart reading skill to build your independent analysis portfolio on Hashtoo.com and earn steady rewards for your research quality.
Important Note (Disclaimer):
This post is only for learning and education. We do not give any “Buy” or “Sell” calls here. We do not tell you to trade or invest. Trading in the stock market involves financial risks. Please talk to a certified financial advisor before putting your real money into the market. The writer receives a fixed page-formatting fee from Hashtoo.com for writing this educational report.
Post Approved For: Hashtoo Educational Hub (Stock Market Track) Verification ID: HT-EDU-TCS-2026
